 Molecular adsorption is the first important step of many surface-mediated chemical processes, from catalysis to lubrication. This phenomenon is controlled by physical/chemical interactions, which can be accurately described by first-principles calculations.
Several computational tools have been developed to study molecular adsorption based on high throughput/automatized approaches in recent years. However, these tools can sometimes be over-sophisticated for non-expert users.
We developed Xsorb a Python-based program for computing the adsorption energy and identifying the optimal adsorption geometry of complex molecules on crystalline surfaces.
At present, the Xsorb relies on Quantum ESPRESSO for DFT calculations. It automatically creates input files and geometries, submits the calculations, collects the data, and allows easy visualization of the results.
Despite its conceptual simplicity, this program effectively reduces the computational workload usually associated with creating and optimizing several adsorption configurations.
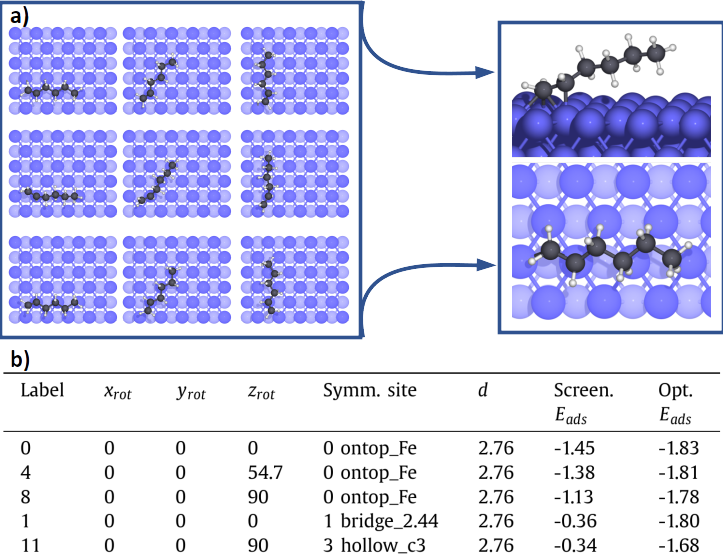
Xsorb workflow is schematically represented in Figure 1 on the right.
Molecular adsorption is the first important step of many surface-mediated chemical processes, from catalysis to lubrication. This phenomenon is controlled by physical/chemical interactions, which can be accurately described by first-principles calculations.
Several computational tools have been developed to study molecular adsorption based on high throughput/automatized approaches in recent years. However, these tools can sometimes be over-sophisticated for non-expert users.
We developed Xsorb a Python-based program for computing the adsorption energy and identifying the optimal adsorption geometry of complex molecules on crystalline surfaces.
At present, the Xsorb relies on Quantum ESPRESSO for DFT calculations. It automatically creates input files and geometries, submits the calculations, collects the data, and allows easy visualization of the results.
Despite its conceptual simplicity, this program effectively reduces the computational workload usually associated with creating and optimizing several adsorption configurations.
Xsorb workflow is schematically represented in Figure 1 on the right. 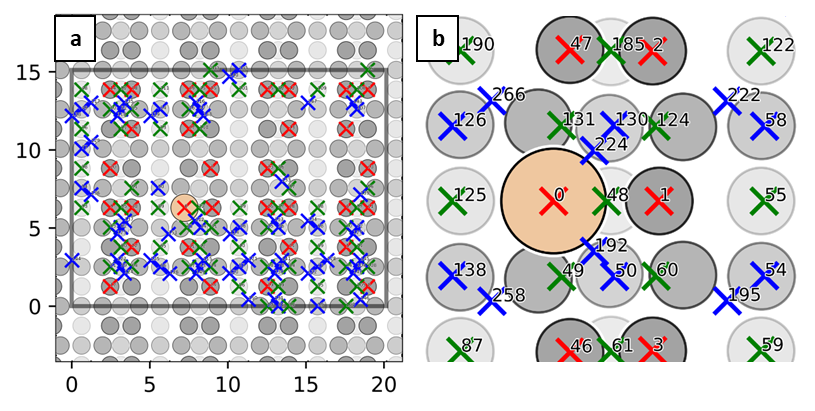
Figure 3: In panel a, visual representations of the adsorption configurations for hexene on Fe(110). The optimal geometry after the full optimization is shown on the right. In panel b, the corresponding adsorption are represented.